Big metros, far from the station
California's cities look as big and as well spaced as Spain's and France's. But fewer of their residents live close to where the train actually stops. This page measures that with one global population grid, using fixed circles around every station on 14 corridors.
The comparison flips as the circle shrinks
Residents per kilometre of route, counted within a radius of any station, relative to the average of Madrid–Barcelona and Paris–Marseille. Above 1.0 means the corridor has more people near its stations per km of track than those two European lines; below 1.0 means fewer.
Every corridor at the same scale
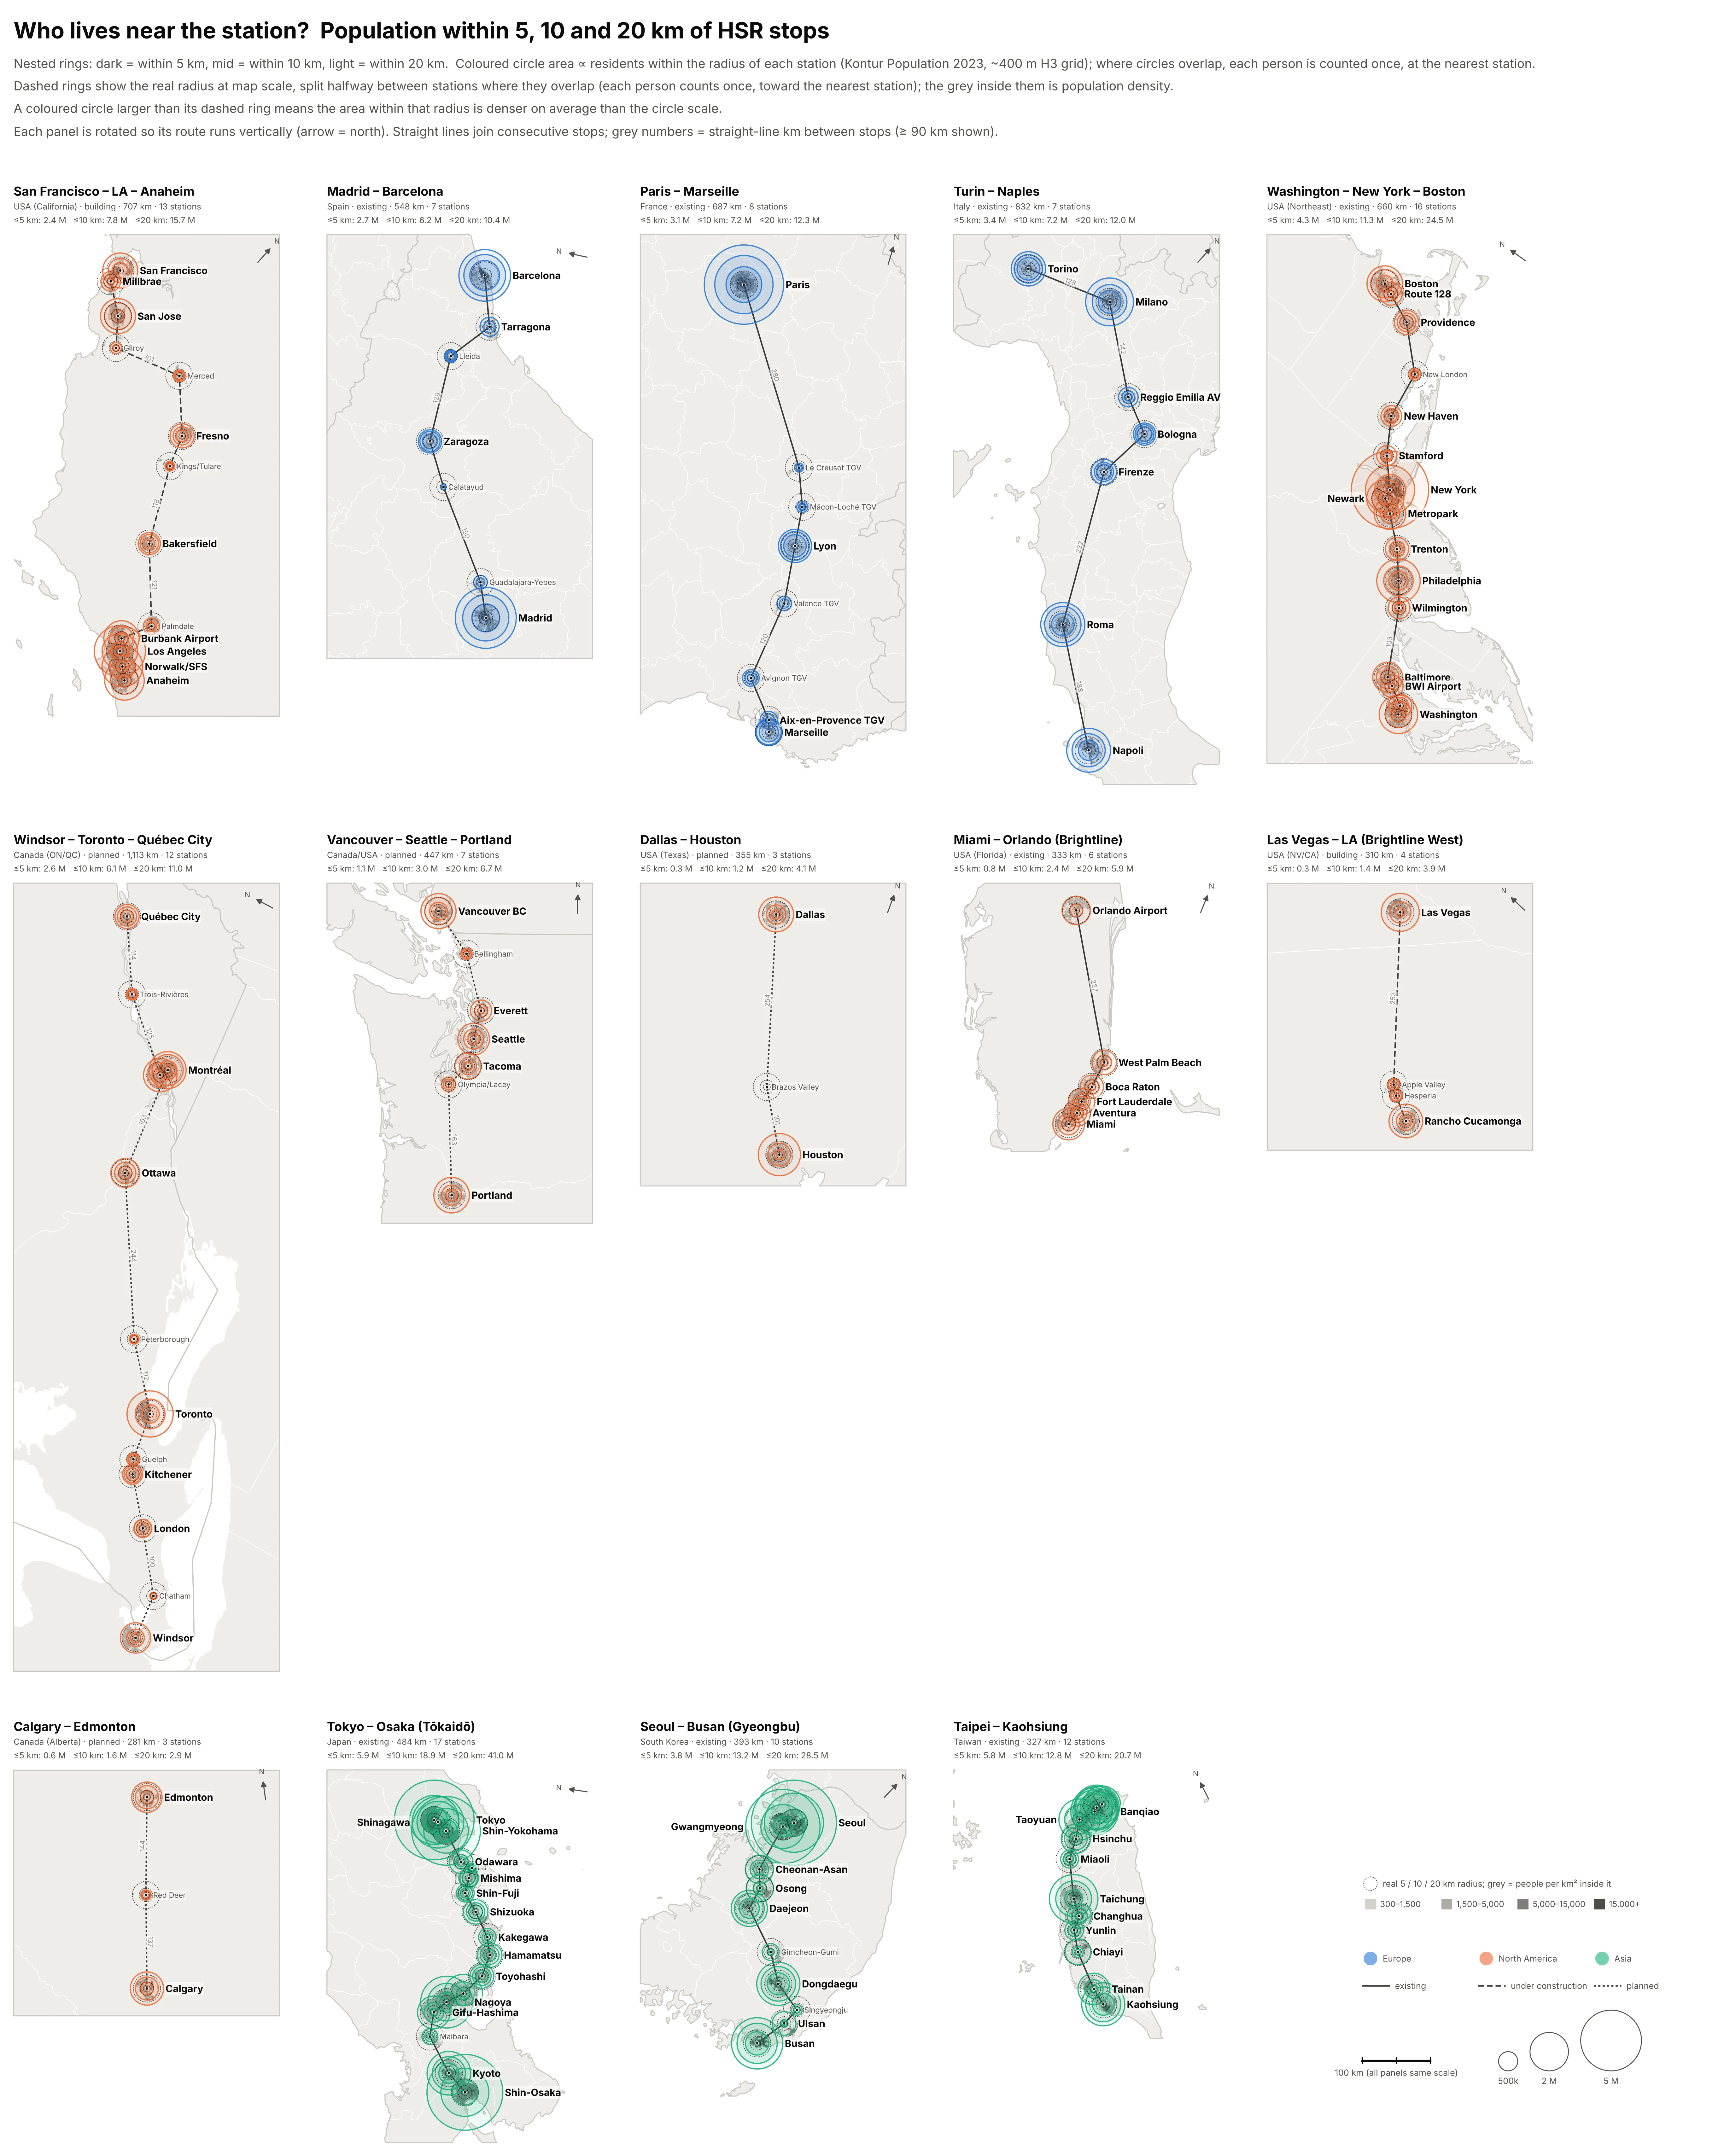
Each panel is rotated so its route runs top to bottom (arrow points north). Coloured circle area is proportional to the population inside the radius. Dashed rings show the real radius at map scale, and the grey inside them shows how densely populated that land is. Where two stations’ rings overlap, a dashed line splits them halfway between the stations, matching how the counts work: each person is counted once, toward the nearest station. When a coloured circle is bigger than its dashed ring, the area inside the radius is denser than the circle scale; when it's smaller, the area is sparser.
Population as height
The same catchments, without circles-on-circles. Each corridor is turned so it runs left to right and tilted into an oblique view, all at the same scale. Every station's catchment is raised into a block whose height is the number of people living in it. Where catchments overlap they're split halfway between stations, so the blocks fit together and nobody is counted twice. The grey ground shows population density out to 50 km.
Station footprints
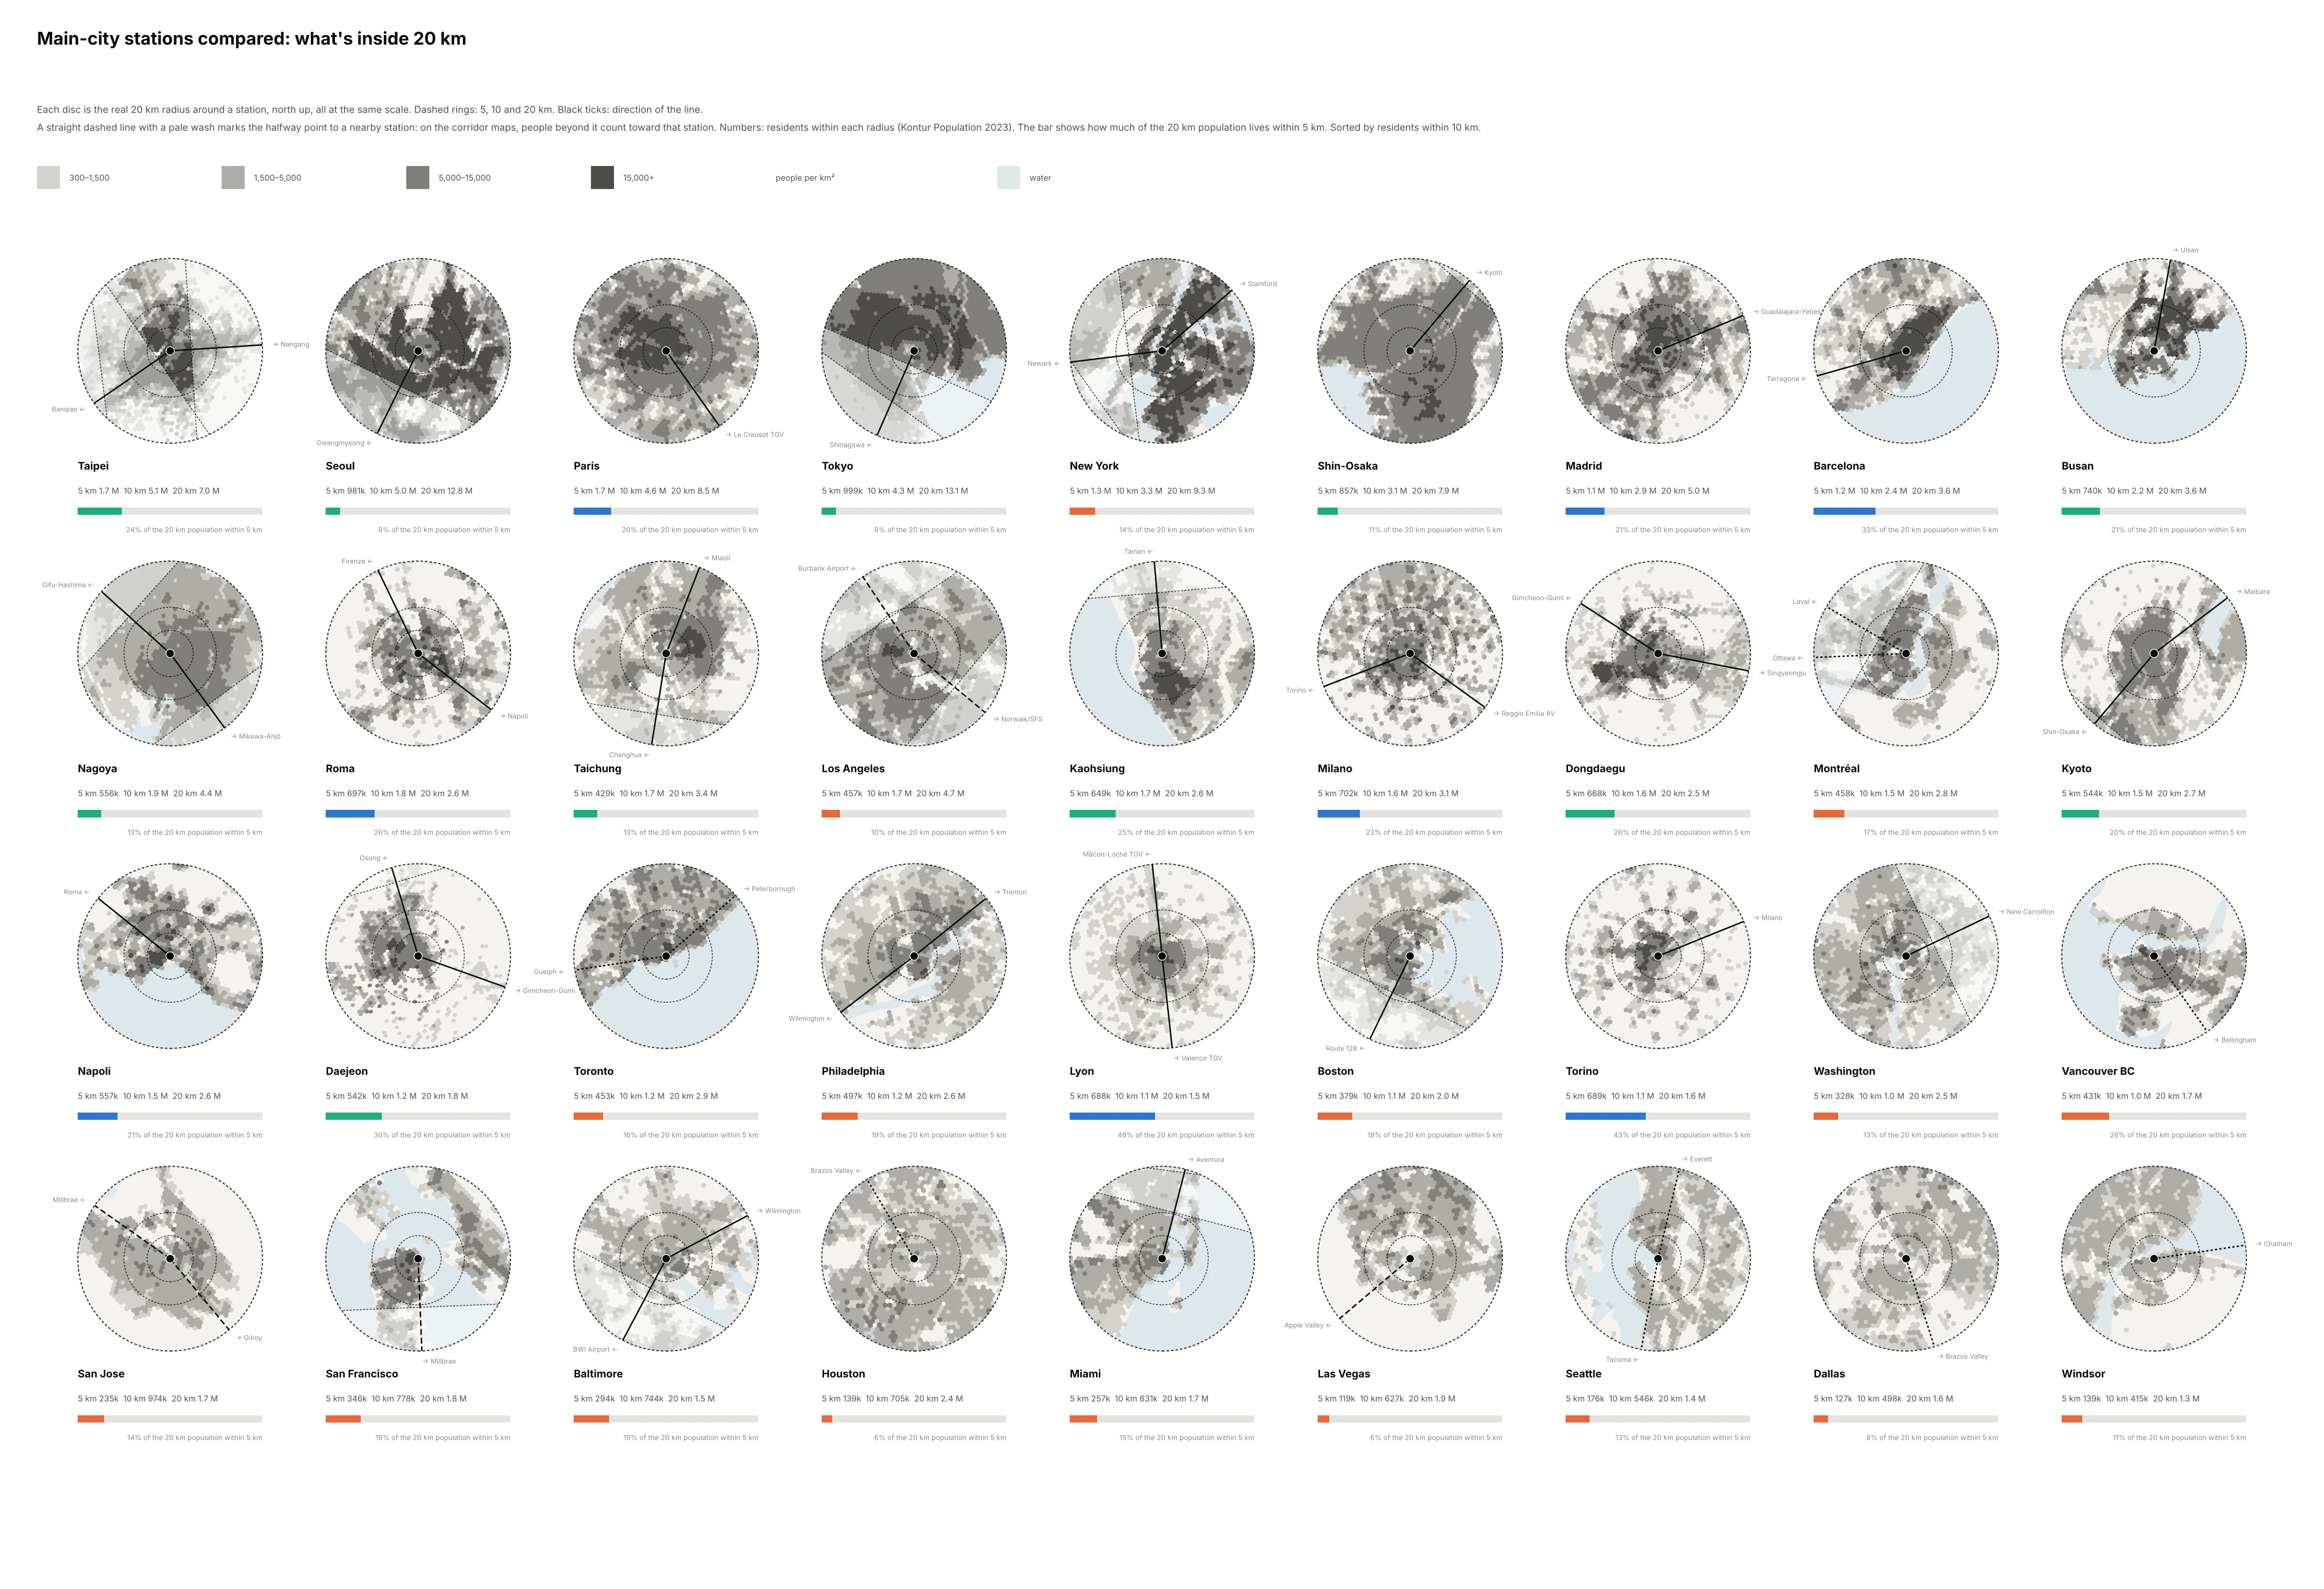
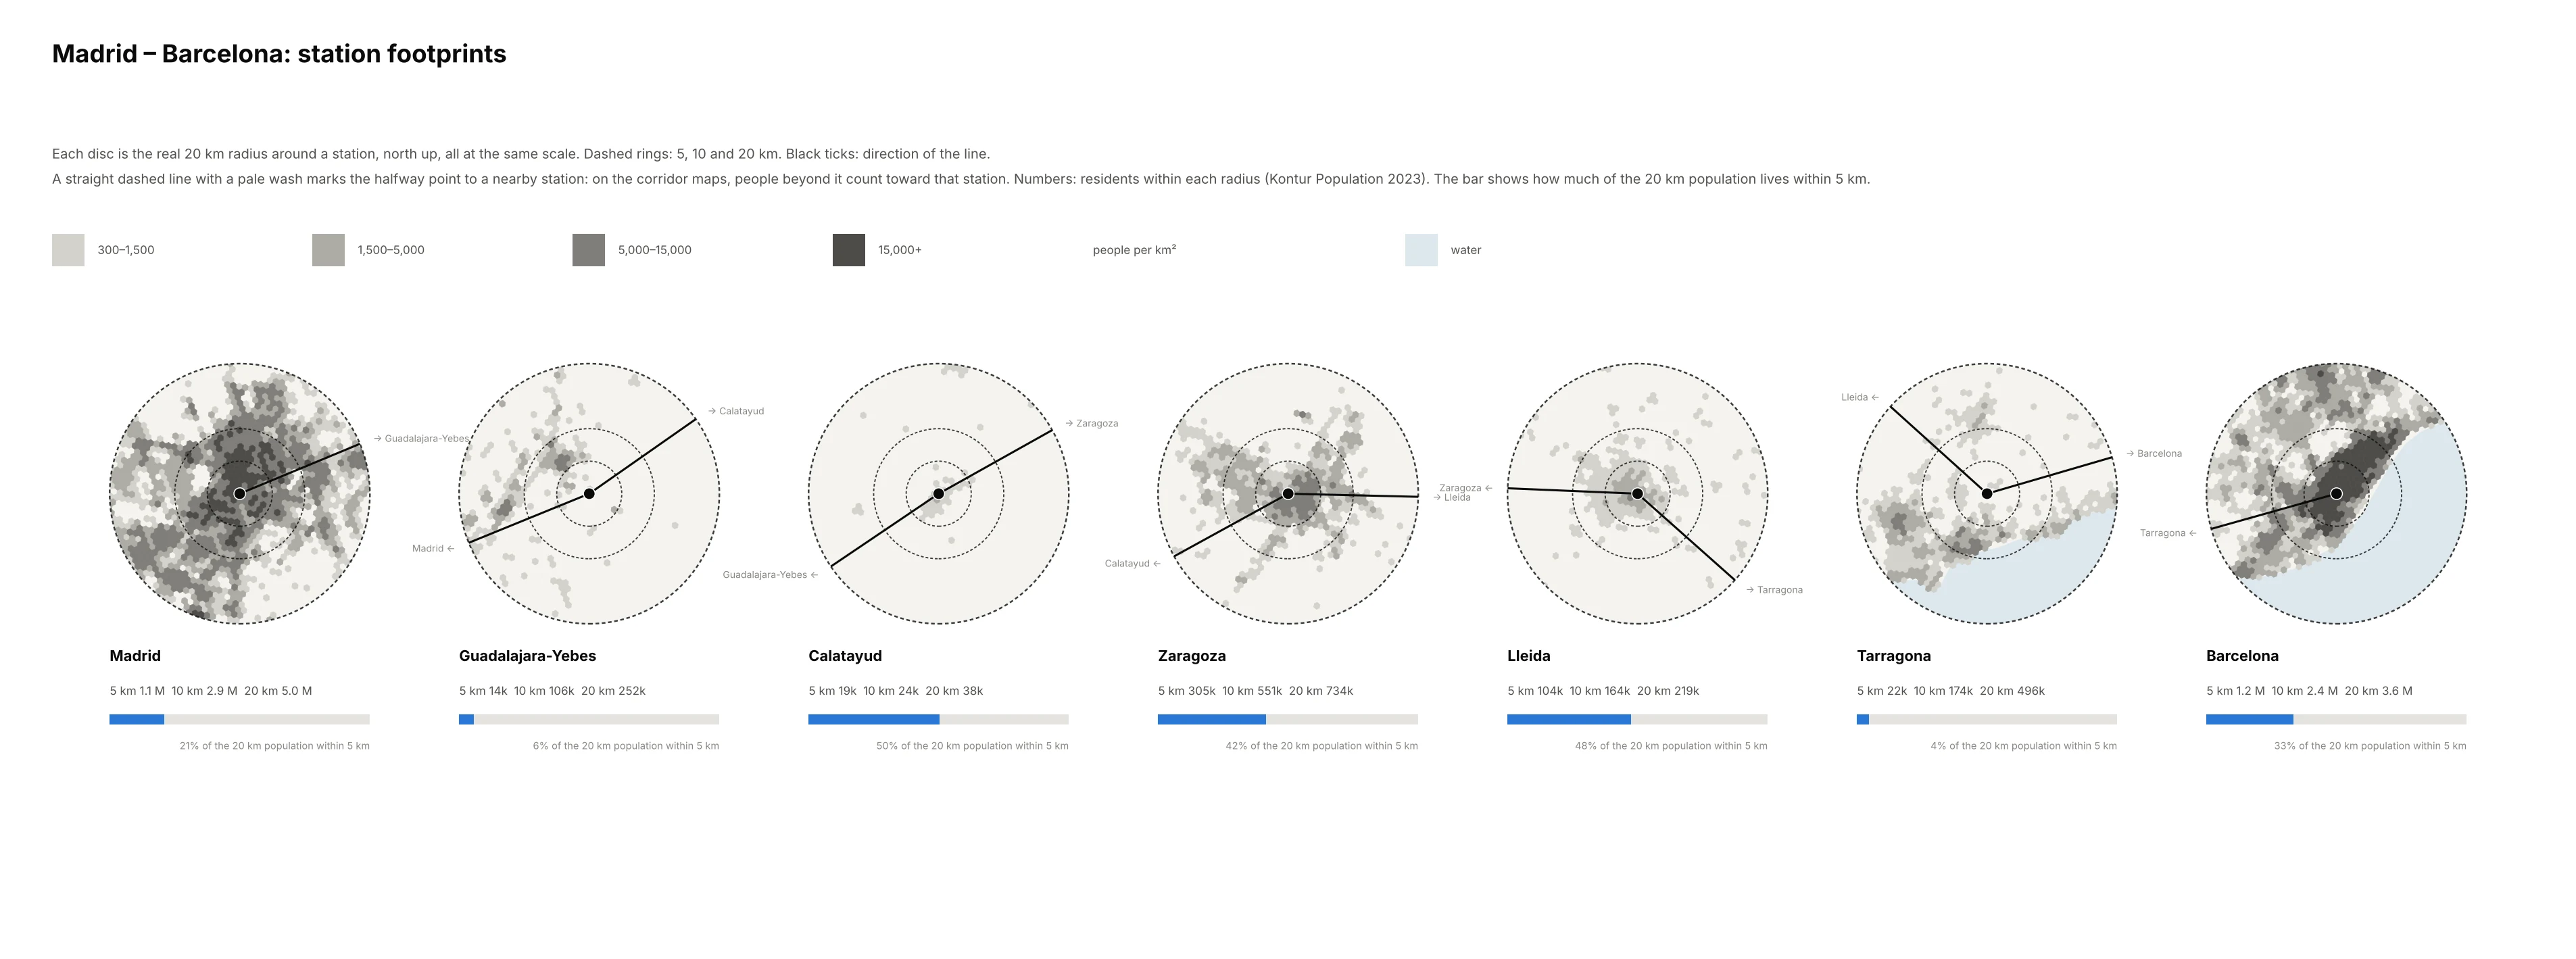
The same 20 km circles drawn large, so you can see what's actually around each main-city station. Where another station sits within 40 km, a straight dashed line and a pale wash mark the part that the corridor maps count toward that neighbour; the numbers under each disc include everything inside it. Every disc uses the same scale, with north up. Grey shows people per km², and dashed rings mark 5, 10 and 20 km. Paris, Tokyo, Seoul and Taipei are dark nearly to the 10 km ring. Los Angeles, Houston and Dallas are an even mid-grey sprawl, with no dense core around the station.
Corridor catchments
How much of the metro is near the station?
For each large metro (at least 2.5 M people within 50 km), the share of that 50 km population living within 5 km and within 10 km of its main station. European cities cluster around 40% at 10 km. Most US cities sit between 8% and 22%.
Station explorer
Method
Each population cell counts for a station if its centre falls within the radius (great-circle distance). Where circles overlap, as at Tokyo/Shinagawa, Taipei/Banqiao, the LA basin and NYC/Newark, each cell goes to its nearest station only, so nobody is counted twice.
The maps use an azimuthal-equidistant projection centred on each corridor, rotated so the route runs vertically. 100 km is the same length in every panel.
Grey shading uses the Kontur hexagons inside each radius, in four density classes: 300–1,500, 1,500–5,000, 5,000–15,000 and 15,000+ people per km². Land under 300 per km² is left blank. The lowest cut-off matches the EU/GHSL definition of an urban cluster, and 1,500 matches an urban centre.
Data
- Kontur Population 2023-11-01: a global H3 res-8 grid (~0.74 km² cells) fusing GHSL, Meta HRSL, Microsoft buildings and Copernicus land cover. It's the only uniform layer here that also covers Canada.
- Meta / CIESIN HRSL: 30 m, used as a cross-check. It agrees with Kontur within a few percent wherever both exist.
- Natural Earth 10 m outlines for the map backgrounds.
Caveats
- Planned station sites are approximate: city centre or the most-cited candidate. The 5 km figures are sensitive to this. Texas Central's Houston terminal is at Northwest Mall, not downtown.
- Windsor–Québec joins the Alto project (Toronto–Québec City) to the older Windsor–Toronto proposal.
- Vancouver–Portland uses the Amtrak Cascades stops as stand-ins for a future high-speed line.
- Counts are residents only. Jobs, visitors and transfer catchments aren't included.